Advertising
After successful events held in previous years with the magnificent success and overwhelming response, we are honoured to announce Blood Disorders 2026 titled 22nd Global Summit on Hematology and Blood Disorders scheduled during at Dubai, UAE.
Blood Disorders 2026 conferences now focus in digital advertising also to help clients inform and attract new customers quickly and efficiently. The size and diversity of our advertising options, including banners, sponsored emails, article alerts or newsletters, provide clients with the very best customized marketing opportunities in science and technology.
Conference website serves as an information hub to all the learning people with all the relevant content provided at a single place. We are one of the renowned conference organizers associated with journals as well where most of them are indexed in esteemed databases like Google Scholar, Scopus and listed in PubMed. The digital advertising platform we provide you is the best chance of showcasing your products/services, and branding your company.
If you are looking for a global exposure for your products and services, then Conferenceseries is the right place for you. We are one of the world’s leading specialist in organizing scientific conferences, workshops, symposia and exhibitions internationally in different fields like Medical, Pharma, Engineering, Science, Technology and Business attracting more than25 Million+ Visitors,25000+ unique visitors per conference and 70000+ page views for every individual conference would help in quantifying our presenters research and biography visibility to the online communities and get recognized worldwide.
Conferenceseries conferences maintain high quality and principled standards of scientific events industry, which makes us exceptional and better than the rest. Conference series is offering a wide range of benefits to promote and expose your brand, product and services to the large number of audience through online advertisement that can connect you to leading experts and specialists across the Globe.
Penetrating the study of visitor, navigation, and traffic patterns to determine the success of our conference website majority amount of traffic we receive from 33 countries/territories from United States of America (USA), Brazil, Canada, Mexico, Australia, New Zealand, China, India, Hong Kong, Indonesia, Japan, Malaysia, Philippines, Singapore, Taiwan, Thailand, South Korea, Austria, Denmark, Finland, France, Germany, Italy, Netherlands, Norway, Poland, Spain, Switzerland, Turkey, United Arab Emirates (UAE), United Kingdom (UK), Ukraine and South Africa.
Average Time spent by each visitor on Site is 2.16 minutes
Benefits / Advantages
- Exposure of your corporate logo in our conference website
- Advertising high quality information of your company/products by linking through our conference website.
- Online advertisement can be extremely effective, can create a bigger space and can help you reach a better kind of customers for your company.
- Share your excitement in promoting your company and ideas with our participants, Research Scholars & Related Companies.
- An exclusive online Promotion on all our Social Networking Sites.
- A4 Color Advertisement in Congress Program or Book of Abstract.
- Shape and raise your corporate image through logo branding.
- Brand briefing at the opening and closing ceremonies.
- Press Release on behalf of your company.
|
Type of Banner |
Location |
Monthly Cost € |
Quarterly Cost € |
Half Yearly € |
Yearly € |
|
|
Main Banner (740px x 90px) |
Homepage |
499 |
1299 |
2199 |
3199 |
|
|
Tower Banner (250px X 250px) |
Homepage |
399 |
1099 |
1999 |
2999 |
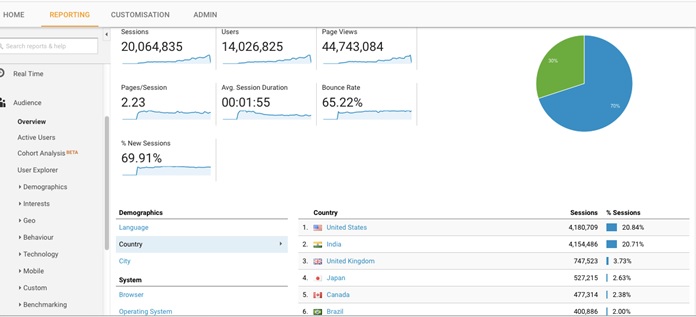
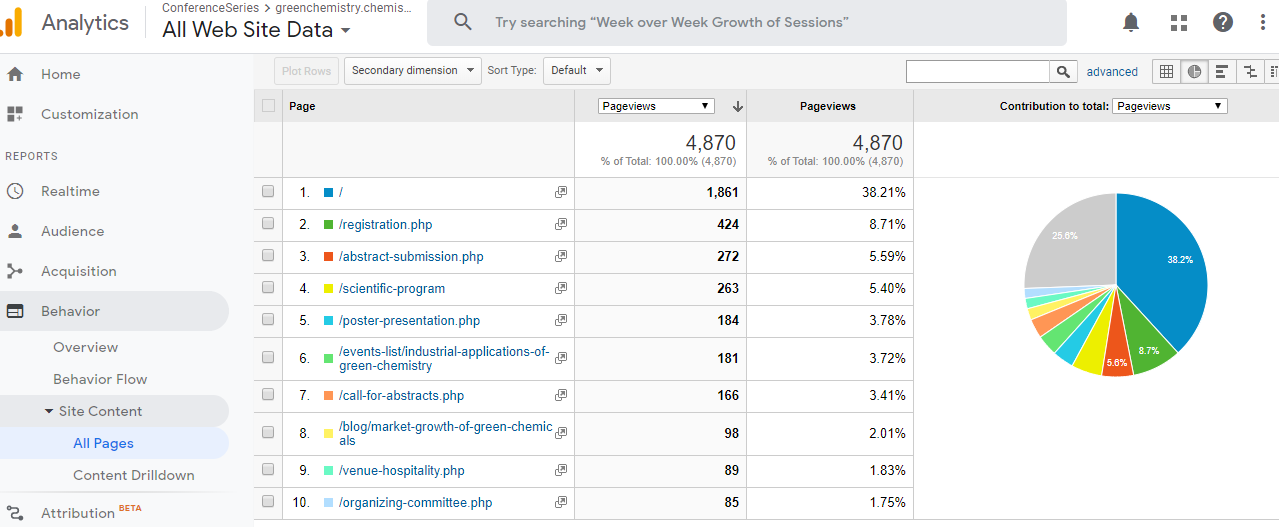
ConferenceSeries Web Metrics at Glance: Source: Google Analytics
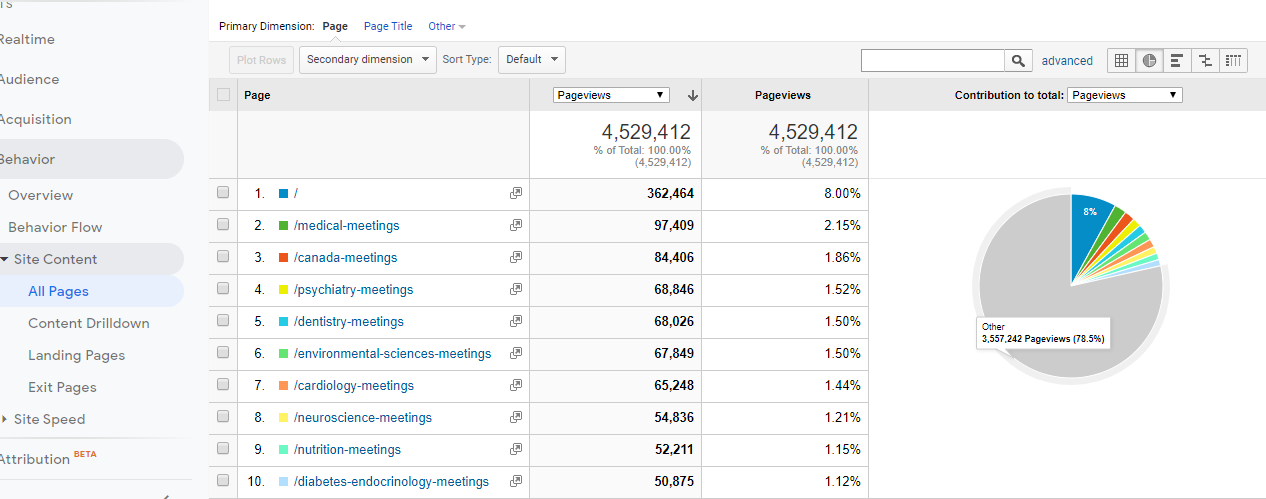
- 25 Million+ Visitors
- 25000+ unique visitors per conference
- 70000+ page views for every individual conference
Out of the 500,000 listing worldwide major conferences attended by 2.5 million attendees 16.8% attendees are drawing only from our Medical, Pharma, Healthcare, Nursing, Engineering, Science, Technology and Business conferences. The main reasons behind the increased popularity of our conference attendees is because of the changing mindsets of academicians, researchers and industries in exploring the opportunities for exchanging ideas, sharing resources, building networks and increase awareness of the on the recent happenings in their research around the world.
Yearly:
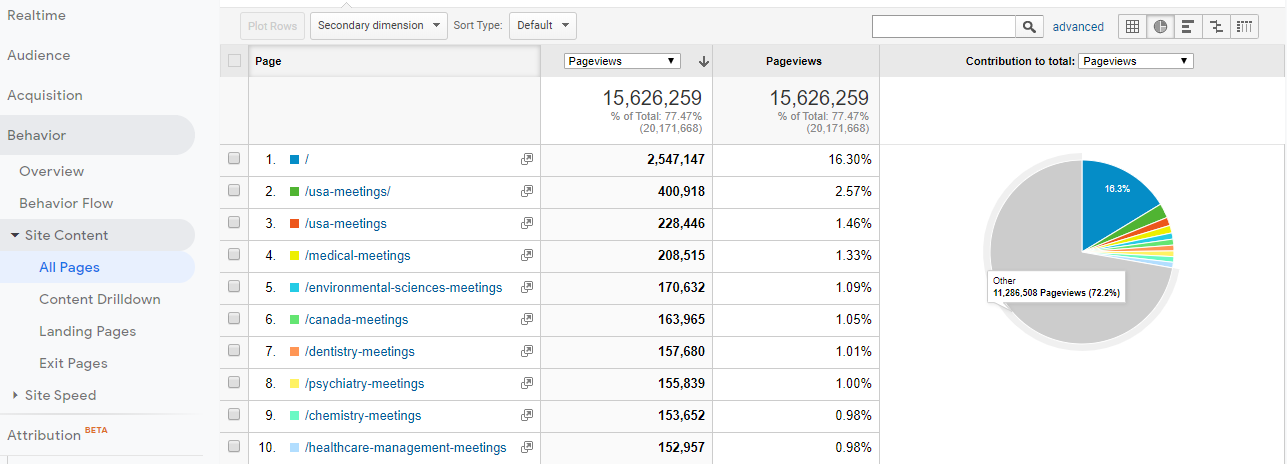
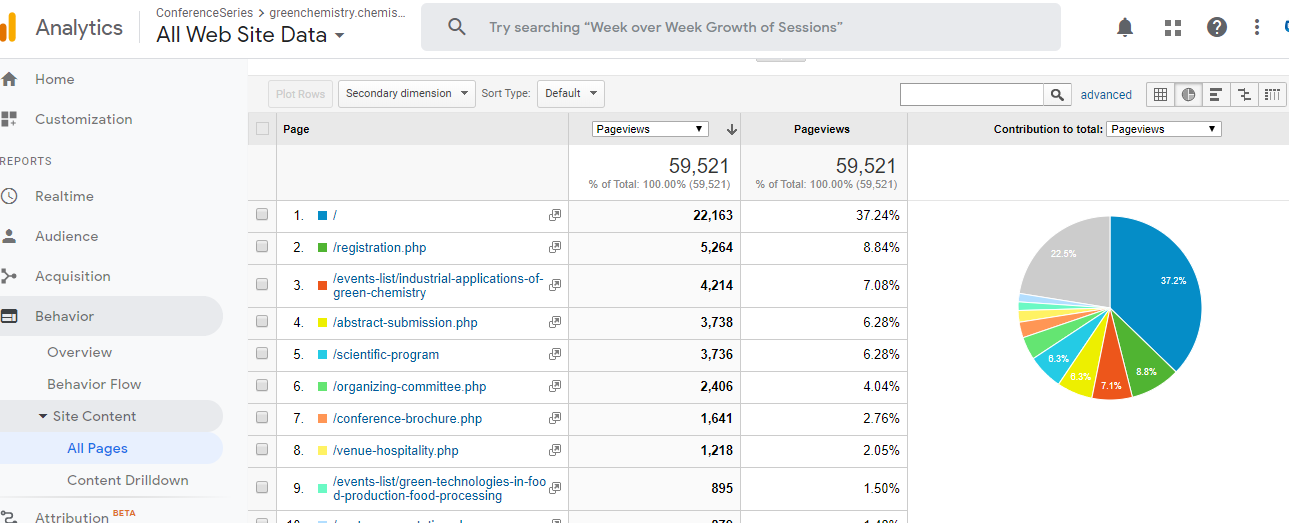
Half yearly:
- 15 Million+ Visitors
- 15000+ unique visitors per conference
- 40000+ page views for every individual conference
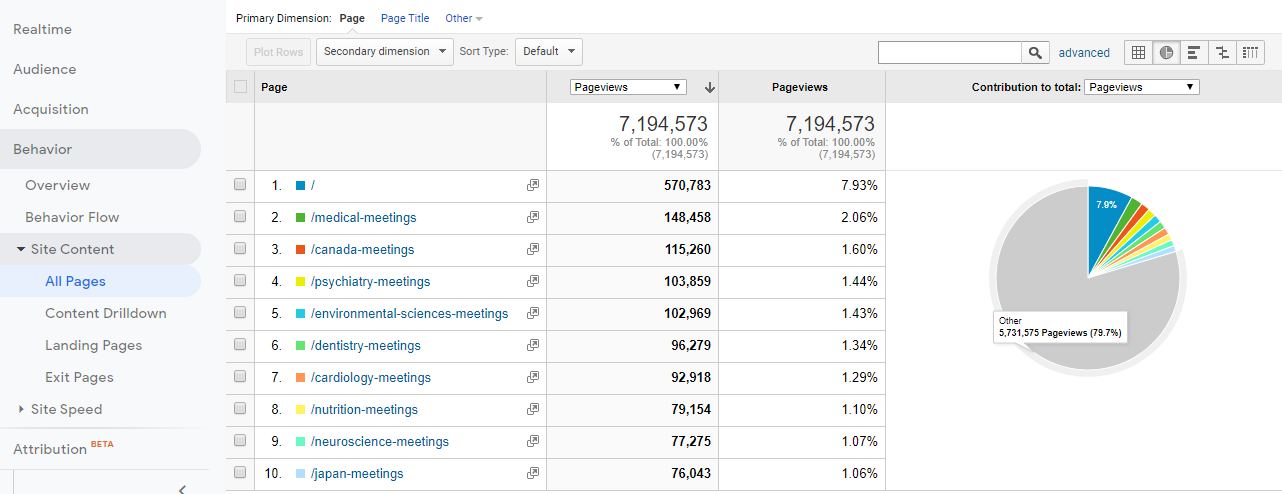
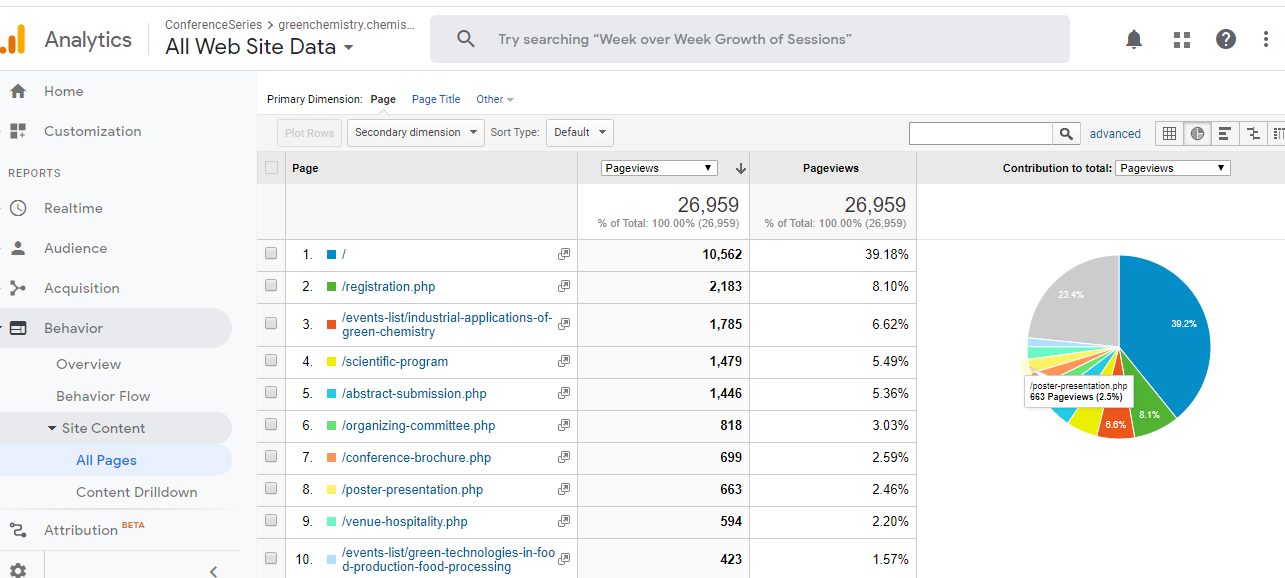
Quarterly
- 7 Million+ Visitors
- 8000+ unique visitors per conference
- 25000+ page views for every individual conference
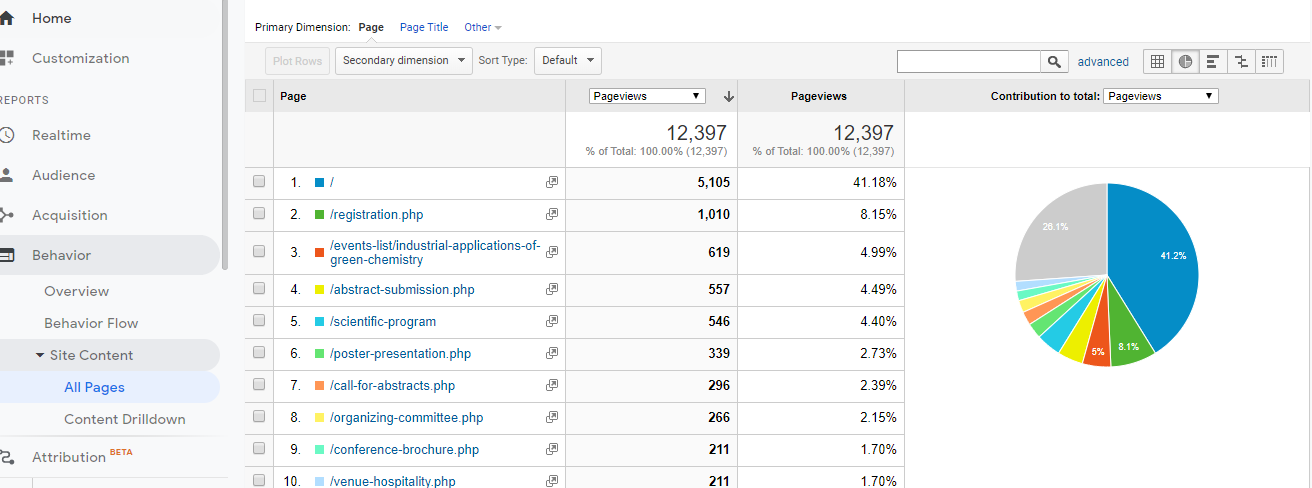
Monthly:
- 4 Million+ Visitors
- 3000+ unique visitors per conference
- 10000+ page views for every individual conference
Blood Disorders 2026 Google Analytics Metrics: At a Glance
A statistical representation of global users for Conference (Source: Google Analytics)
The visitor’s traffic is the benchmark for the success of any website and the 22nd Global Summit on Hematology and Blood Disorders is constantly attracting viewers across the world.
According to the Google Analytics report, more than 55692 visitors are checking our conference website for submitting abstracts, to browse the information about conference, latest research on our conference topics. Most of the conference website views were globally reported and summarized from both developed and developing countries. Majority of the visitors are Young Researchers and students.
Yearly Visitors: 79,521
Half Yearly Visitors: 46,952
Quarterly visitors: 22,397
Monthly visitors: 9,870
Yearly
Half yearly:
Quarterly
Monthly
The promotion of the individual company is taken care of and reputation among global audience. Conferenceseries values the contributions take suitable measures in propagating and promoting their outcomes by permanently archiving as well.

